
PKR extends gains, edges up against USD

Published Date: April 20, 2026
Published On: Mettis Global Link
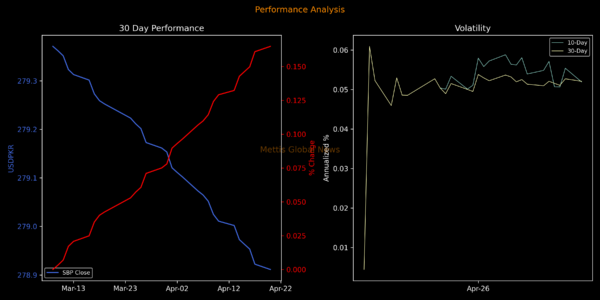
Pakistani rupee (PKR) recorded a modest appreciation against the US Dollar in Monday’s interbank session, gaining 1.1 paisa to settle at 278.91 compared to the previous close of 278.92.
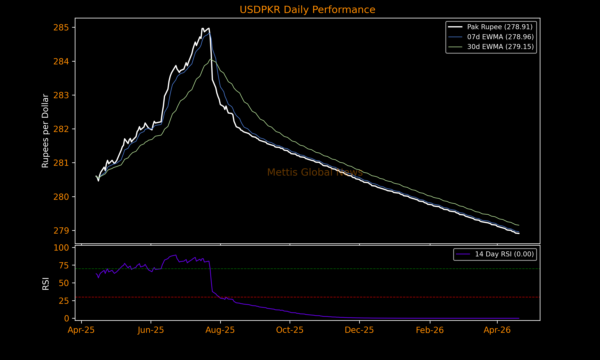
During intraday trading, the local currency touched a high (bid) of 279.10 and a low (ask) of 278.80, reflecting relatively stable movement throughout the day.
In the open market, exchange companies quoted the dollar at 279 for buying and 279.95 for selling, maintaining a slight premium over interbank rates.
Against major global currencies, the PKR showed a mixed performance. The rupee strengthened against the Euro, appreciating by 64.05 paisa (0.19%) to close at 328, compared to 328.64 in the previous session.
Similarly, the local unit gained ground against the British Pound, rising by 57.27 paisa (0.15%) to settle at 376.52, down from 377.09 a day earlier.
However, the rupee weakened against the Swiss Franc, slipping by 57.78 paisa (0.16%) to close at 356.64.
Against the Japanese Yen, the PKR depreciated by 0.23 paisa (0.13%) to 1.7538, compared to 1.7515 in the previous session. It also lost 4.48 paisa (0.11%) against the Chinese Yuan, closing at 40.90.
In regional currency comparisons, the rupee edged down by 0.40 paisa (0.01%) against the Saudi Riyal to 74.36, while it posted a marginal gain of 0.30 paisa against the UAE Dirham to settle at 75.93.
On a cumulative basis, the rupee has strengthened by 4.85 against the US Dollar during the current fiscal year, reflecting an appreciation of 1.74%.
On a calendar year basis, the PKR has gained 1.21, translating into an increase of 0.43%.
In the money market, benchmark 6-month Karachi Interbank Bid and Offer rates edged down by 3 basis points, settling at 11.22% and 11.47%, respectively, indicating slightly eased short-term liquidity conditions.
Performance Summary
| Currency | Apr 20, 2026 | Apr 17, 2026 | 1D | 7D | 1M | FYTD | CYTD | |||||
|---|---|---|---|---|---|---|---|---|---|---|---|---|
| USD | 278.9112 | 278.9222 | 0.0110 | 0.00% | 0.0907 | 0.03% | 0.3410 | 0.12% | 4.8533 | 1.74% | 1.2119 | 0.43% |
| EUR | 327.9996 | 328.6401 | 0.6405 | 0.20% | -1.7766 | -0.54% | -8.2419 | -2.51% | 4.6575 | 1.42% | 0.8509 | 0.26% |
| GBP | 376.5162 | 377.0889 | 0.5727 | 0.15% | -1.9143 | -0.51% | -6.3116 | -1.68% | 12.3404 | 3.28% | 0.6556 | 0.17% |
| CHF | 356.6412 | 356.0634 | -0.5778 | -0.16% | -3.5859 | -1.01% | -4.2058 | -1.18% | -1.3138 | -0.37% | -3.4186 | -0.96% |
| JPY | 1.7538 | 1.7515 | -0.0023 | -0.13% | -0.0062 | -0.35% | 0.0000 | 0.00% | 0.2162 | 12.33% | 0.0354 | 2.02% |
| SAR | 74.3565 | 74.3525 | -0.0040 | -0.01% | -0.0115 | -0.02% | 0.0066 | 0.01% | 1.3039 | 1.75% | 0.3380 | 0.45% |
| AED | 75.9335 | 75.9365 | 0.0030 | 0.00% | 0.0350 | 0.05% | 0.1042 | 0.14% | 1.3339 | 1.76% | 0.3424 | 0.45% |
| CNY | 40.9000 | 40.8552 | -0.0448 | -0.11% | -0.0726 | -0.18% | -0.4451 | -1.09% | -1.2966 | -3.17% | -0.8272 | -2.02% |
52 Week Performance
| Currency | High | Low | Trading Band | % Since High | % Since Low | High Date | Low Date | Days Since High | Days Since Low |
|---|---|---|---|---|---|---|---|---|---|
| USD | 278.9112 | 284.9710 | 6.0598 | 0.00% | 2.17% | 20-Apr-26 | 22-Jul-25 | 0 | 272 |
| EUR | 312.8629 | 335.6068 | 22.7439 | -4.61% | 2.32% | 12-May-25 | 28-Jan-26 | 343 | 82 |
| GBP | 366.2051 | 390.0418 | 23.8367 | -2.74% | 3.59% | 05-Nov-25 | 26-Jun-25 | 166 | 298 |
| CHF | 333.3532 | 365.8872 | 32.5340 | -6.53% | 2.59% | 12-May-25 | 28-Jan-26 | 343 | 82 |
| JPY | 1.7458 | 1.9999 | 0.2541 | -0.46% | 14.03% | 27-Mar-26 | 22-Apr-25 | 24 | 363 |
| SAR | 74.3320 | 75.9801 | 1.6481 | -0.03% | 2.18% | 07-Apr-26 | 16-Jul-25 | 13 | 278 |
| AED | 75.9335 | 77.5864 | 1.6529 | 0.00% | 2.18% | 20-Apr-26 | 22-Jul-25 | 0 | 272 |
| CNY | 38.3943 | 40.9252 | 2.5309 | -6.13% | 0.06% | 22-Apr-25 | 14-Apr-26 | 363 | 6 |